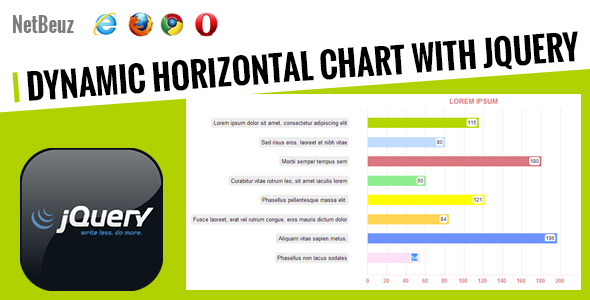
Dynamic Horizontal Chart with Javascript
- Last Update
- 18 July 2013
- Regular License
- $5
- Extended License
- $25
- Sales
- 6
NetBeuz Dynamic Horizontal Chart
-You can create any size, any color, any much of charts charts dynamically and easily. -NO require knowledge in JavaScript . -NO css file included. -NO images. -Easy Usage. -Automatic Y axsiss. It creates itself according to max item value. -You can set link with items. -You can set nameHolder area’s width percent. -You can change colors, styles, size of charts. In netbeuz.js file. -Compatibility for all browsers. (expect border-radius in IE7 /IE8)
USAGE:
Step 1: All to do is create a html code like below. span>color property is bar’s color. and span>value property is bar’s value.
<div id="myChart" caption="PROGRAMMING LANGUAGES CHART"> <ul> <li><span color="#b5d600" val="95"><a href="" title="ASP.NET">ASP.NET </a></span></li> <li><span color="#c0dcff" val="80"><a href="" title="C#">C# </a></span></li> <li><span color="#db7780" val="40"><a href="" title="Php">Php </a></span></li> <li><span color="lightgreen" val="60"><a href="" title="Java">Java </a></span></li> <li><span color="yellow" val="50"><a href="" title="Python">Python </a></span></li> <li><span color="#ffd554" val="84"><a href="" title="XCODE">XCODE </a></span></li> <li><span color="#ffe0f7" val="45"><a href="" title="Android">Android </a></span> </li> </ul> </div>
Step 2: Just one code is enough to run. myChart(width,height); >
$("div#myChart").myChart(1000, 400);
-This item require Jquery library.
