PHP Profiler - Check & Debug Memory & Time Usage
- Last Update
- 21 November 2012
- Regular License
- $8
- Extended License
- $40
- Sales
- 7
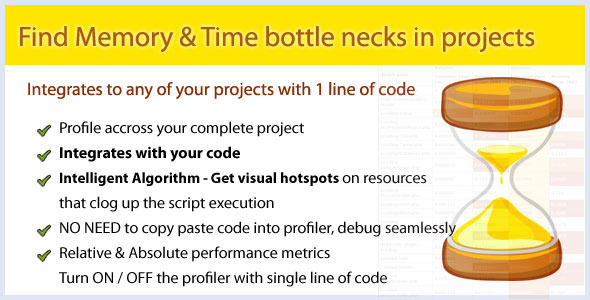
PHP Code Profiler is a Profiling Class that helps you debug your code of Memory & Execution hogs in a very intuitive manner. Capable of functioning across any existing/new PHP Project, this class is very light on memory and uses very less footprint.
PHP Code Profiler comes with an Intellingent Algo which helps you with Visual Clues (Hotspots) to identity the hogs in your code. It is as simple as that.
With the ability to TURN OFF the profiler dynamically, you can not manage a single version of your code even while debugging. No need to remove the profiling code from your main code each time.
Example Profiling Code
<?php ini_set('display_errors', 1); // Include the profiling library include_once 'libs/class.profiler.php';
Profiler::watch("Loaded Common");
// Include your project file require_once 'require.php'; Profiler::watch("Start System plugins loader");
foreach ($plugin_list as $plugin) { loadPlugin($plugin); Profiler::watch("Loading {$plugin}"); } ?>
Example Profile Result
