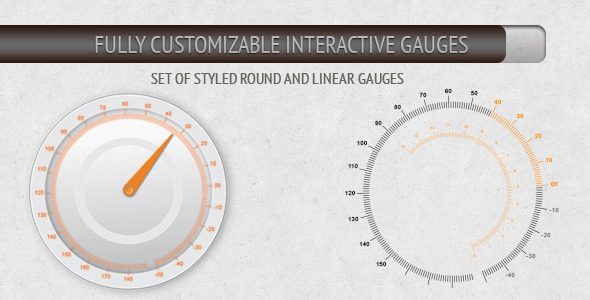
jsGauges
- Last Update
- 15 December 2011
- Regular License
- $7
- Extended License
- $35
- Sales
- 83
JsGauges About JsGauges is a JavaScript software that allows you to show two types of analog gauges on your web- page. That could be classical round gauges like a speedometer or linear like an ordinary thermometer. Gauges are fully configurable, so you can easily create your own design by changing CSS -like settings.
Script uses two libraries:
RaphaelJS
JSON parser
RaphaelJS is a powerful JavaScript library. It is used to draw and animate SVG or VML graphics. JSON parser is used to analyze JSON data in older browsers. This script builds interactive gauges using vector graphics. This is a cross-browser solution and it works in:
IE7 +
Safari
Firefox 3+
Chrome
Using AJAX technology script downloads JSON file from server and updates current gauge state. A lot of settings allow you to create your own design. Installation is easy and doesn’t require much time.
Features
Retina ready. Gauges are scalabel vector images.
Animated. With adjustable update time.
Cross-browser. Even IE7 .
Fully customizable. CSS -like settings.
JSON data format. (Less traffic)
Gauge backgroung can be filled with a JPG or PNG image with your own design.
Adjustable “Red zone” warning.
Three value zones for linear gauges. Green, yellow and red. Red zone with warning.
